Spectrum One
Open-hardware WiFi activity monitor built on ESP32. Scans nearby wireless signals and displays them in real time on an LED bar and LCD. OSHWA certified. Full source, Gerbers, and firmware included.
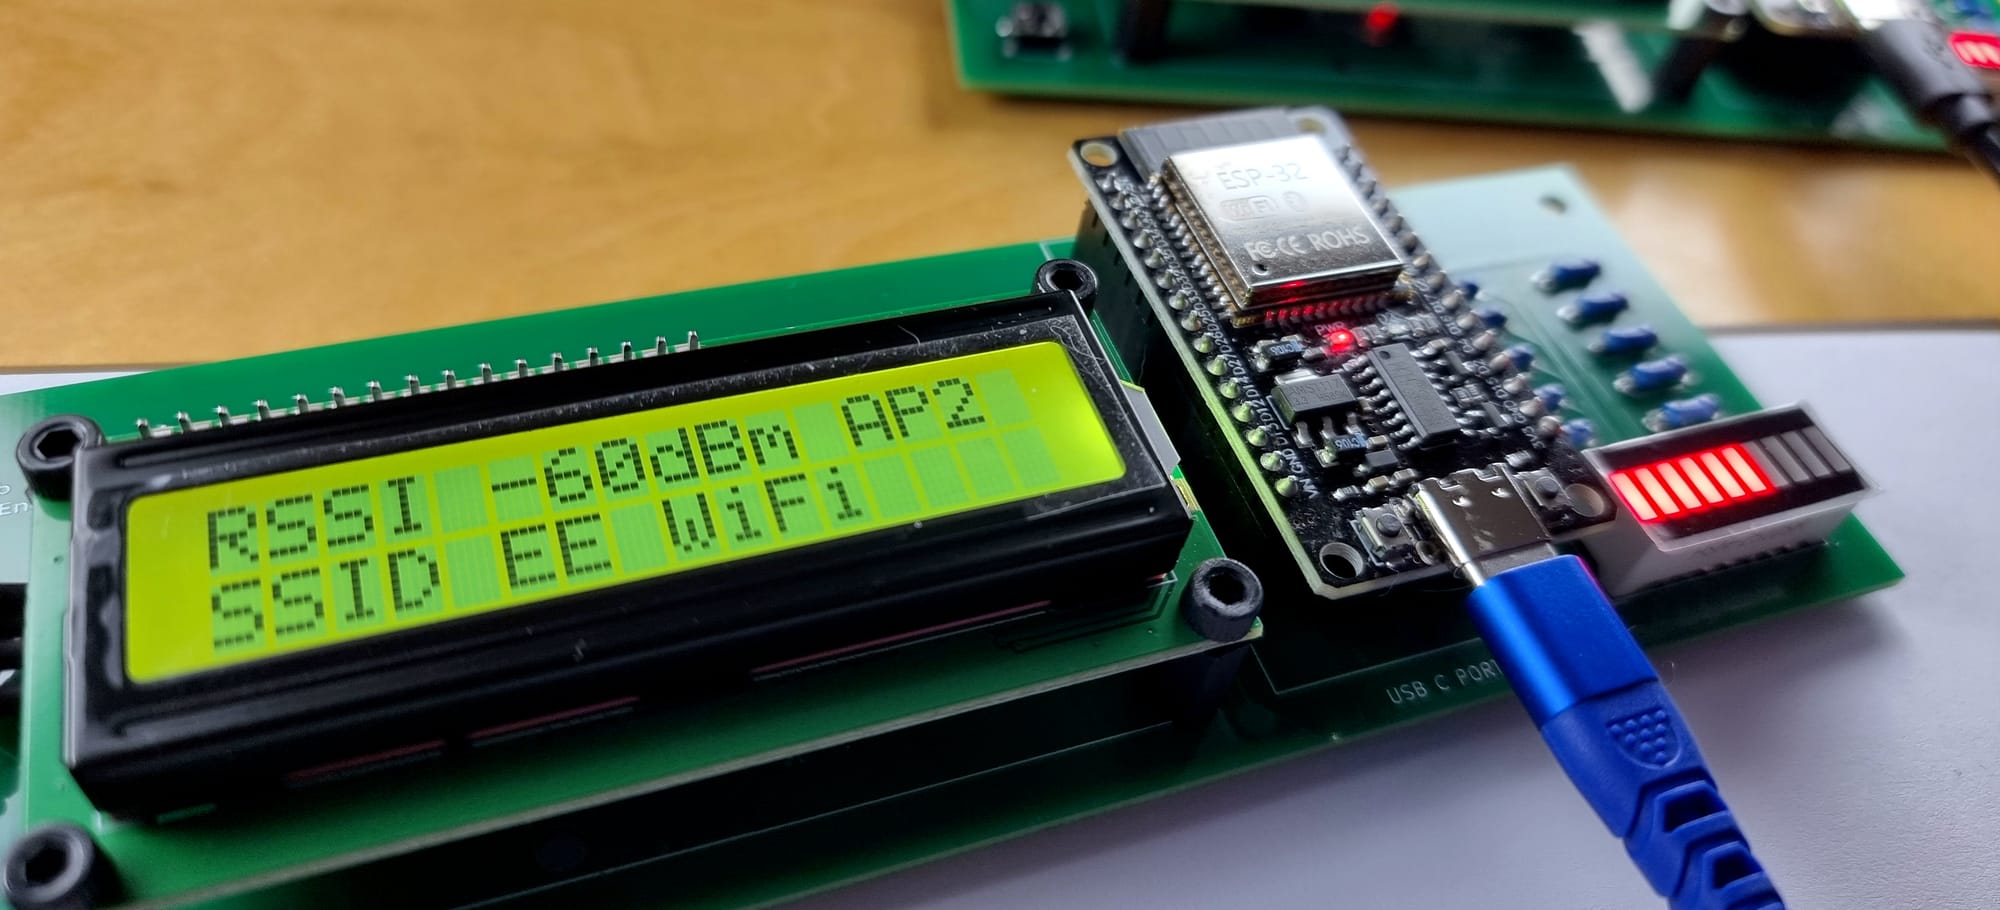
A compact WiFi activity monitor built around the ESP32. It picks up nearby wireless signals and turns them into something you can actually see — an LED bar that reacts in real time, an LCD that gives you context, and a single button to keep things simple.
It sits on your desk, does its thing, and stays out of the way. Without a phone, without an app, without anything else running in the background.
The whole project is open hardware, certified by OSHWA (UID: UK000086).
What the display shows
Spectrum One continuously scans the local Wi-Fi environment and presents the results using a small set of fixed UI modes.
Each mode shows the same scan data, organised differently. Switching modes does not change what is measured — only how it is displayed.
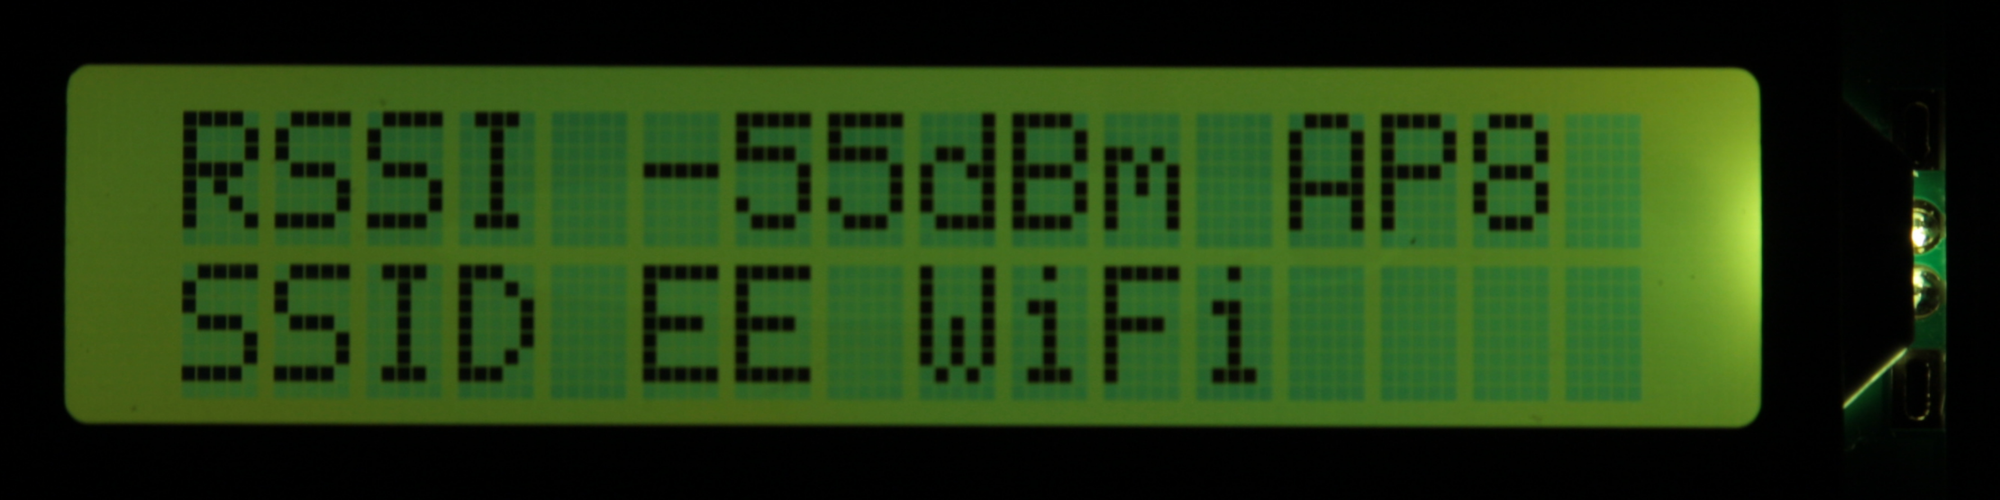
UI mode 0 — Strongest access point
This mode follows the strongest access point detected in the most recent scan.
- AP means Access Point — a Wi-Fi transmitter such as a router, extender, or hotspot.
Spectrum One does not connect to it. It only observes it. - The number next to AP is the count of access points detected in the latest scan.
- The RSSI value shown belongs only to the strongest access point.
As scans repeat, both the strongest access point and the access-point count may change as networks appear, disappear, or vary in strength.
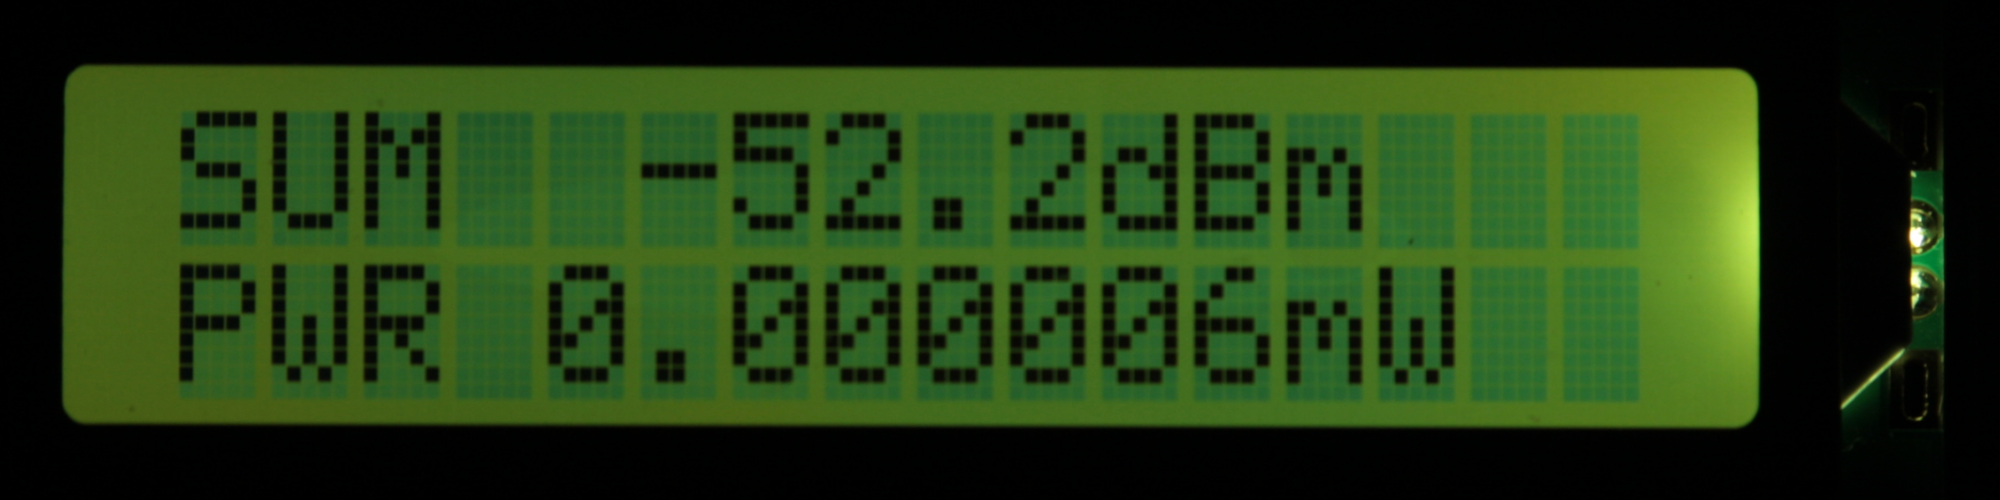
UI mode 1 — Total power (SUM)
This mode shows the combined signal strength of all access points detected in the scan.
The value is a heuristic sum of RSSI values.
It is not a calibrated RF measurement, but a relative indicator of how much Wi-Fi activity is present overall.
This mode is useful for comparing different locations or observing how overall wireless activity rises and falls over time.
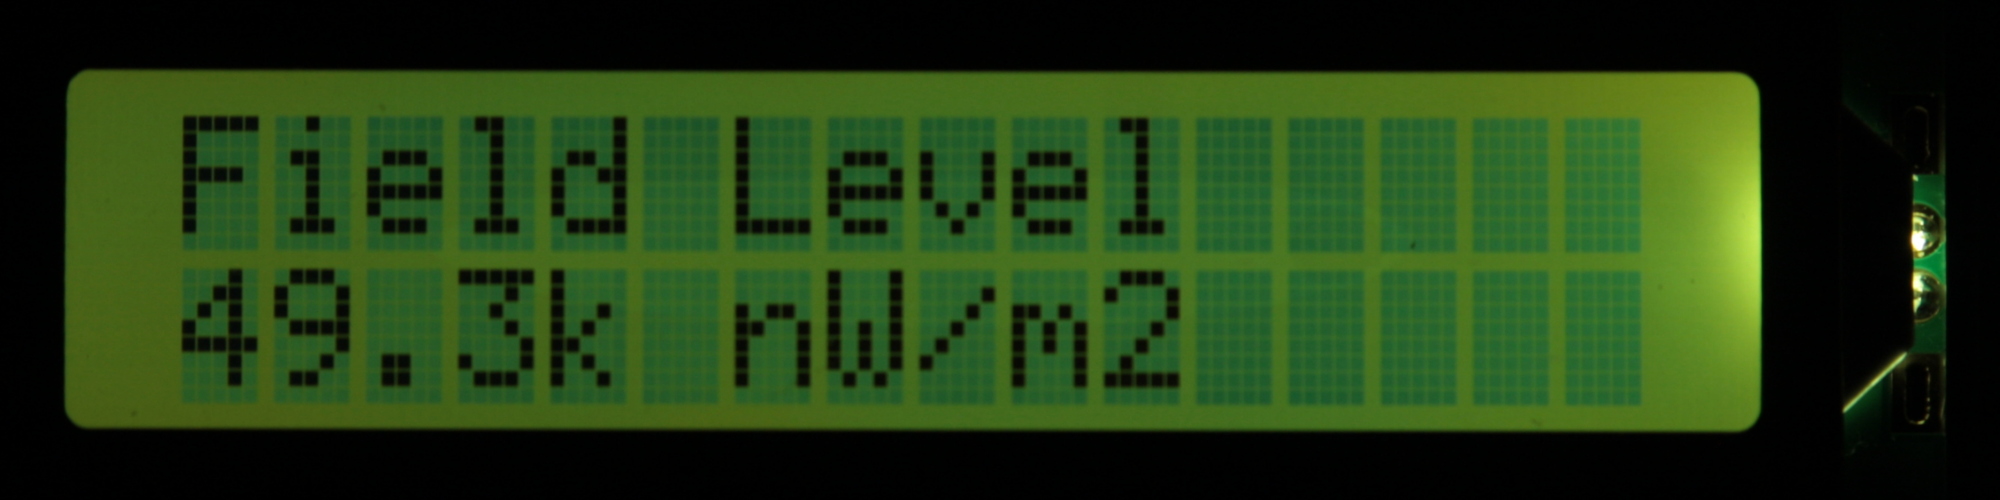
UI mode 2 — Field level
This mode shows a general field activity level derived from the scan results.
Individual access points are not listed.
The display provides a steady, at-a-glance view of ambient Wi-Fi activity rather than network-specific detail.
This is the default observational view when you want to watch changes without focusing on individual networks.
Browsing and follow mode
Spectrum One lets you interact with detected Wi-Fi access points in two related ways: browsing and follow mode.
Both operate on the Strongest Access Point view and use the same scan data.
Browsing (surfing)
Browsing lets you step through the access points from the most recent scan, one by one.
- Enter browsing with a long button press on the Strongest Access Point screen
- Each short press advances to the next access point
- The display shows:
- access point name (SSID)
- signal strength (RSSI)
- position in the list
- The LED bar reflects the RSSI of the currently selected access point
While browsing:
- scanning is paused
- the list is a fixed snapshot from the last scan
If there is no interaction, browsing exits automatically after a short timeout and returns to the normal display.
Follow mode
Follow mode is used to track a single access point continuously.
To enter follow mode:
- Enter browsing (long press)
- Step to the desired access point (short presses)
- Long press again to lock onto it
Once locked:
- scanning continues
- the display always shows the RSSI of the selected access point
- the device tracks the access point by SSID, updating its position each scan
If the access point disappears, the display indicates that the locked access point is lost.
Exiting follow mode
A long press exits follow mode:
- browsing is cleared
- tracking stops
- the device returns to the Field level display
Browsing vs follow mode
- Browsing is for inspecting a scan snapshot without it changing.
- Follow mode is for watching one access point change over time.
One is static, the other is live.
Scan timing and update rate
Spectrum One runs Wi-Fi scans continuously inside the main application loop.
The scan cadence is controlled directly in the firmware:
- The scan loop ends with
vTaskDelay(pdMS_TO_TICKS(500)); - This call appears in
spectrum_one.cat line 518 - It sets the delay between scan cycles to approximately 500 ms
In practice, this means the device performs about two scans per second.
Each display update reflects the most recent completed scan.
The delay is intentional. It balances:
- responsiveness of the display
- stability of the readings
- CPU load and power consumption
Changing this value directly affects how fast the display reacts to changes in the environment.
The Book
ESP32 WiFi Activity Monitor: Spectrum One – From Breadboard Prototype to Custom PCB
by Jay J. Reszka
This is the story of how the project actually got built. It starts with a messy breadboard, jumper wires everywhere, and a vague idea about watching WiFi. It ends with a custom PCB, certified open hardware, and firmware that does exactly one thing well.
Along the way it covers everything that went into making it real — pin behaviour that caught me off guard, wiring decisions that mattered more than expected, display logic, firmware design, and the slow process of turning something that works on my desk into something someone else can reproduce.
If you like building things and understanding how they work, this one's for you.
Free download in PDF and EPUB.
Source Files
Gerber files, schematics, KiCad layouts, firmware, pre-built binaries, and assembly docs — everything you need to fabricate, flash, and build the board yourself.
The Gerbers are production-ready and include a ZIP you can upload straight to any PCB fab house.
GitHub: https://github.com/currenari/spectrum-one
There's more coming.